 As ever I am doing lots of work on labour market data and education and training. While we know pretty well how to take great slabs of data and turn it into various different charts - some more imaginative than others - this still leaves problems in how to illustrate ideas. data charts can be pretty dull - more than that they rely on the ability of the user to interpret that data - what we call the move from labour market information to labour market intelligence.
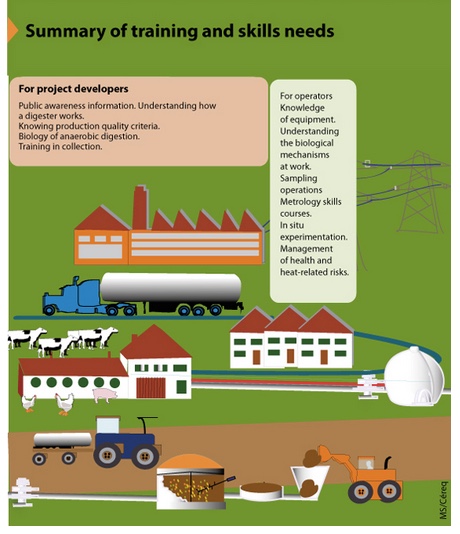
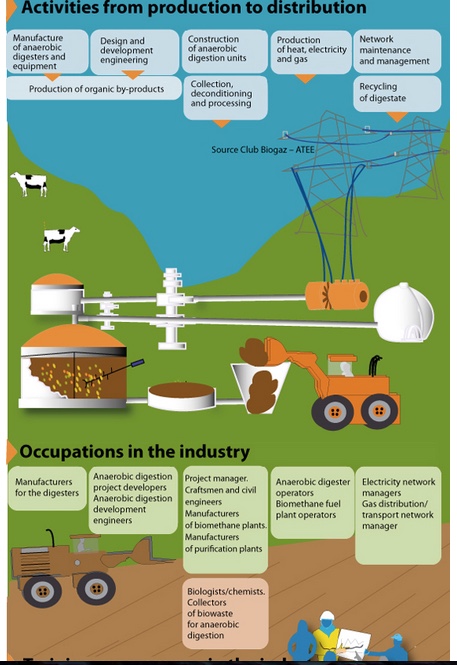
I have long been interested in the potential of info graphics in helping develop such intelligence but had yet to see any meaningful examples. Thus, I was very impressed with this graphic about the training and skills needs in the anaerobic digestion industry in the monthly newsletter from Cereq - the French Centre for Research Education, Training and Employment.
The only real problem is that the infographic - like many others is much too long for a small laptop screen (this I have only been able to capture parts of it). But it would be great as a poster.