There's a huge amount of information and some really cool visualisations of LMI available from CEDEFOP and Eurostat and we've been helping Vocational educators make some sense of it in our Career Pathways project. From our portal you can access dashboards with info about the demand for specific occupations across 28 European countries, or even what skills are in most demand in specific regions.
To help, we've created short explanatory videos and accompanying notes for each section - here's how to navigate the demand for occupations dashboard as an example...
Navigating the Demand for Occupations Dashboard
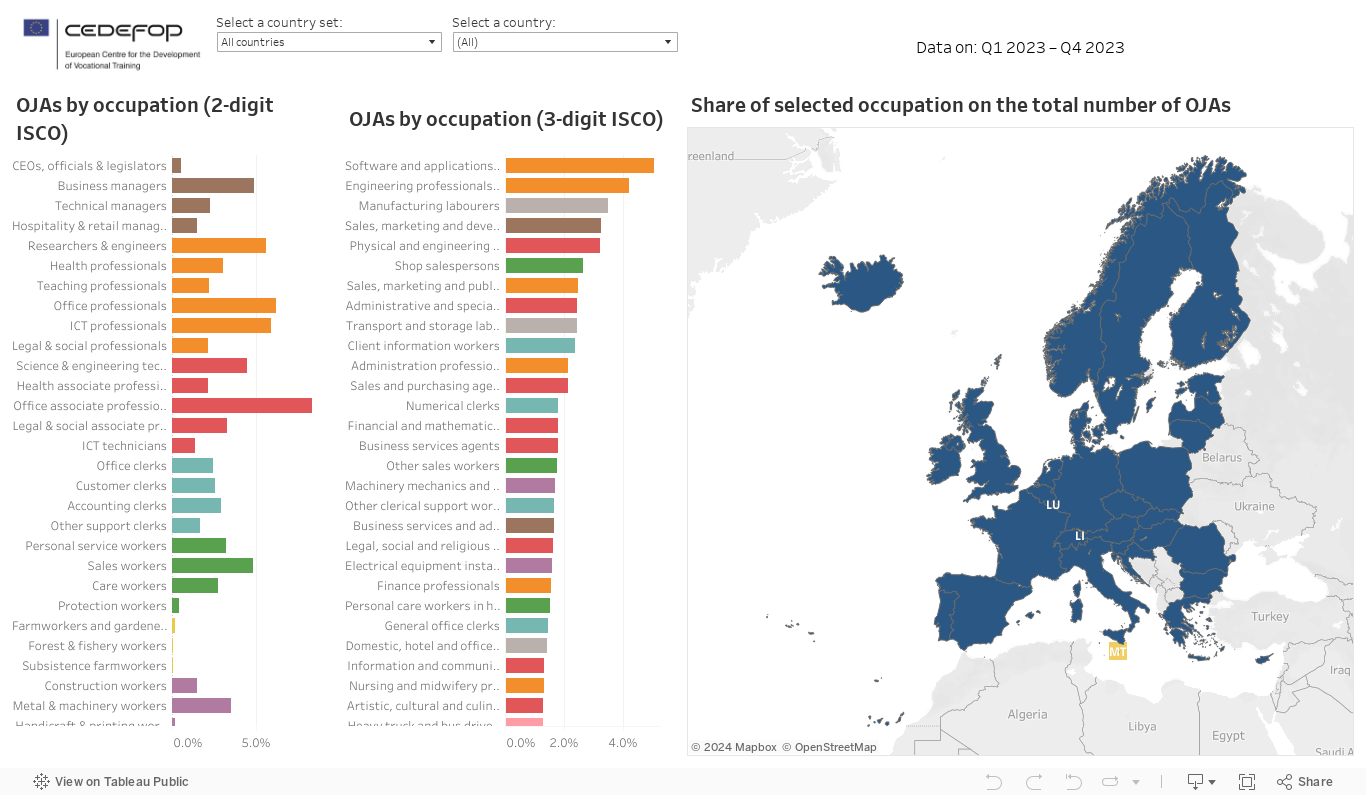
Let’s look into the labour market data available through the My Career Pathways Web Portal. The dashboard provides comprehensive information based on online job advertisements, categorised by ISO codes at both 2-digit and 3-digit levels. This interactive feature allows users to explore various occupational demands in detail.
For example, if you are interested in researchers and engineers, you can click on the relevant category. This action reveals more specific 3-digit codes, such as those for professionals in architecture, electrical technology, life sciences, physical and earth sciences, and mathematics. The accompanying graph displays the corresponding data for each country, with darker blue shades indicating a higher percentage of job advertisements in that occupation and lighter blues representing a lower percentage.
Next, consider office associate professionals. This category includes roles such as administrative and specialised secretaries, sales and purchasing agents, financial and mathematical associates, business services regulators, and government associate professionals. By selecting this category, you can observe how the graph updates to show the distribution of job advertisements. Higher percentages are evident in certain regions, while very pale blue areas indicate zero percentage of online job adverts in that field.
Vocational educators can use this data to inform career counselling, stay updated on the current demand for specific occupations across European countries, and provide tailored advice to students and job seekers. Emphasising fields with high demand and job growth helps guide career choices effectively. Additionally, the dashboard’s geographic insights reveal which areas in Europe have a particular demand for certain jobs, enabling targeted job placements and helping job seekers identify immediate opportunities.
By aligning your curriculum with market needs, you can ensure that your training programs are relevant and responsive to the evolving labour market, preparing your students for the occupations that are most in demand. This data-driven approach enhances the effectiveness of vocational education and supports successful career outcomes for learners.
Key Points for Vocational Educators:
- Inform career counselling with current demand for specific occupations.
- Stay updated on the occupational demands in different European countries.
- Align curriculum with the latest market needs to enhance student preparedness.